Capacity building
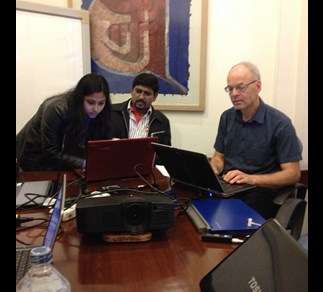
In the Norwegian Meteorological Institute (MET Norway), we are developing a climate analysis and downscaling tool, of which our Indian partners have become pilot users. This tool, developed under the R-programming for statistical computing - is designed to be intuitive, flexible and user-friendly, and prompted our colleagues to make a move from using Excel to the more versatile and flexible R-environment. R software runs on all platforms and is free.
After two weeks of training in R and ‘esd’, our indian partners, starting with no programming knowledge, learned how to handle huge amount of data, make plots and produce climatic maps, and run ‘esd’ based on selected weather stations located in western himalayan region in India.
Learning to master R in itself will be a significant enhancement of their long-term ability to work with statistics and data analysis, including climate.
There has been two-ways of capacity building. While our pilot users learned to use our tool and R, we also benefited to learn about weaknesses and strengths concerning our tool. One particular issue was related to missing values in weather variables and how to deal with gaps in the data record. Missing data and interpolation can give misleading results in terms of trend analysis.
We also had the opportunity to test the framework of our empirical-statistical downscaling (ESD) on a very different climate than Norway, that is the western himalayan region influenced by the indian monsoon.
The tool is based on the free and open R-environment, and is available as open-source computer code hosted by the social coding web platform known as ‘github’.
April 2015